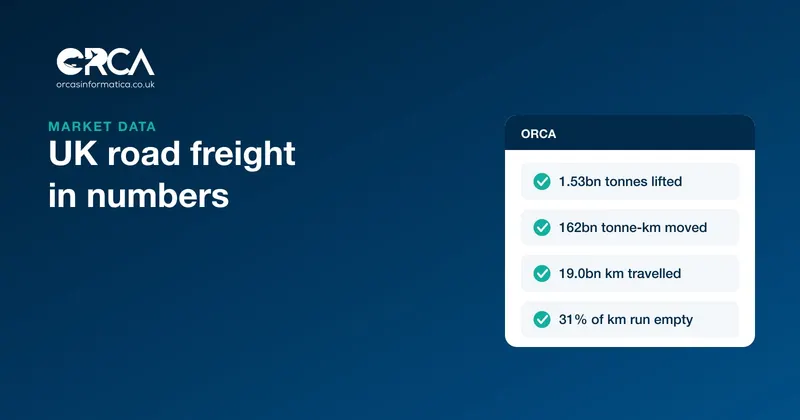
UK road freight statistics for 2025 show a market doing slightly less work with almost a third of its lorry miles carrying nothing at all. According to the Department for Transport (DfT), GB-registered heavy goods vehicles (HGVs) lifted 1.53 billion tonnes of goods in the UK in 2025, 3% less than in 2024, and moved 162 billion tonne kilometres, down 4%. They travelled 19.0 billion kilometres, and 31% of those kilometres were run empty.
This post sets out the headline figures from DfT's latest releases, what they show about how freight moves in the UK, and what we think they mean for small and medium operators competing on efficiency.
Where the numbers come from
The figures come from DfT's Domestic road freight statistics, United Kingdom: 2025, published on 27 May 2026, and the more recent quarterly release covering April 2025 to March 2026, published on 5 August 2026. They are based on a survey of GB-registered HGVs operating in the UK, so they cover lorries over 3.5 tonnes, not vans.
One caution from DfT itself: the survey moved from paper to online in 2021, and DfT says comparisons with earlier data should not be made. So the trends below compare recent years only.
The headline figures for 2025
| Measure (GB-registered HGVs, UK) | 2025 | 2024 | Change |
|---|---|---|---|
| Goods lifted | 1.53 billion tonnes | 1.59 billion tonnes | down 3% |
| Goods moved | 162 billion tonne km | 168 billion tonne km | down 4% |
| Distance travelled | 19.0 billion km | 19.4 billion km | down 2% |
| Distance travelled empty | 5,897 million km (31%) | 30% of distance | up 1 point |
| Average length of haul | 105 km | 106 km | down 1% |
Goods lifted is the weight of goods loaded. Goods moved multiplies that weight by the distance carried, so it measures the transport work done. Both fell faster than the distance driven, which means each kilometre travelled did a little less work in 2025 than in 2024.
The latest 12 months
The quarterly release for the 12 months to March 2026 suggests the decline has levelled off. Goods lifted were 1.56 billion tonnes, similar to the previous 12 months, and goods moved were 164 billion tonne kilometres, 1% lower. Empty running was 30% of distance. In the first quarter of 2026, empty running fell to 28%, compared with 33% a year earlier.
How freight moves
A few details from the 2025 release are worth knowing:
- Groupage is the biggest category. Mixed loads of consolidated consignments made up 25% of goods lifted, 383 million tonnes. The top 5 commodities together accounted for 72%.
- Articulated lorries lift most of the goods. Articulated vehicles lifted 63% of goods by weight and rigid vehicles 37%, the same split as 2024.
- Rigid lorries do the short work. The average haul was 134 km for articulated HGVs and 58 km for rigids.
- Volumes swung more through the year. Goods lifted varied by up to 14% between quarters in 2025, compared with no more than 8% in 2024, from 360 million tonnes in the first quarter to 408 million in the second.
- Pallets lead. Across all journeys, palletised goods were the most common cargo type at 27%, followed by solid bulk at 23%.
Lorries and vans on the road
The freight survey measures what HGVs carry. DfT's separate road traffic estimates for 2025, published on 20 May 2026, measure how much they drive, and they tell the same story from a different angle:
- Lorry traffic was 16.3 billion vehicle miles in Great Britain, 1.7% lower than 2024 and 5.1% lower than 2019.
- Van traffic was 58.8 billion vehicle miles, similar to 2024 (up 0.5%) and 10.0% higher than 2019.
Lorry miles are below where they were before the pandemic, while van miles are well above. The figures do not say why, but the growth in smaller, more frequent deliveries is one likely reason. Either way, it matters to small operators in two ways. Van fleets now carry a bigger share of the work, and they sit outside the HGV freight survey, so the national figures understate how much planning work happens in vans. And a firm running a mix of lorries and vans has two quite different operations to plan.
The number that matters most: empty running
Nearly 5.9 billion kilometres were driven empty by GB-registered HGVs in 2025. That is almost a third of all lorry kilometres, every one of them paid for in diesel, driver time, tyres and wear.
Some empty running cannot be avoided. A tipper delivers aggregate and drives back to the quarry; a specialist vehicle has no return load for what it carries. But the share of empty kilometres is not fixed. The quarterly figures moved from 33% in the first quarter of 2025 to 28% in the first quarter of 2026, which shows how much it changes with the work available and the way it is planned.
What the figures mean for small operators
These are national averages, and no small haulier is average. But they point to where the pressure is. This is our reading of them.
Less work, shared among the same operators. With goods lifted and goods moved both down in 2025, there was less work to go round. When the market shrinks, the operators who keep their margins are the ones who get more out of every vehicle, not the ones who cut prices.
The cost is in the kilometres, not the tonnes. Distance fell by less than the work done. For a small fleet, that gap is margin lost: the same diesel, the same driver hours and the same wear, for less revenue.
Groupage favours good planning. A quarter of all goods lifted are mixed consignments. Groupage pays when loads are combined well and drops are put in a sensible order, and costs money when they are not.
Swings need flexibility. A 14% swing between quarters is hard on a small fleet with fixed costs. Knowing which vehicles are busy and which are idle helps you decide whether to subcontract, hire in or turn work away.
Data used to be something only large fleets had. National carriers have had planners and dashboards for years. The difference now is that the same information can come from the system a small operator already uses to run the day.
How Orca helps you compete on efficiency
Orca measures your own operation from the trips you already run, so you can compare yourself with the national picture.
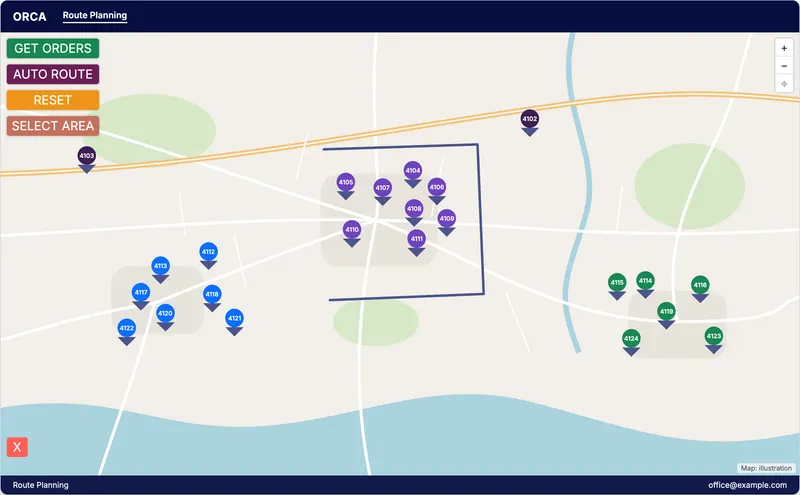
- Route planning. The Route Planning screen puts your open orders on a map. Auto Route groups orders that sit close together, and a trip's stops can be put in order automatically.
- Utilisation from your own trips. Orca's operational dashboard measures Vehicle Utilisation Rate (how many available vehicle days were spent on a trip) and Capacity Utilisation by weight and by volume (what each trip carried against the vehicle's maximum).
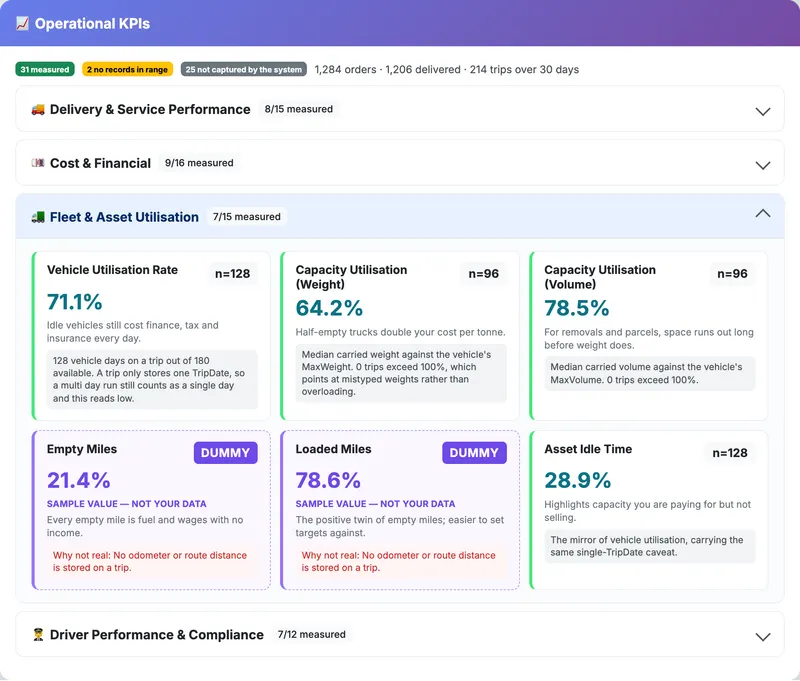
Orca does not record mileage yet, so it cannot measure your empty running directly. Utilisation by weight and volume is the closest measure it gives today, and the dashboard says plainly which figures it cannot yet measure.
Questions to ask about your own fleet
- What share of your vehicle days are spent on a trip?
- How full is the average trip, by weight and by volume?
- Which regular routes come back empty, and could a return load be found?
- How much of your work is groupage, and how well is it combined?
- How much do your volumes swing between quarters, and how do you cover the peaks?
For practical ways to cut the cost of every kilometre, see our guide to cutting fuel costs and carbon emissions.
Frequently asked questions
How much freight is moved by road in the UK?
In 2025, GB-registered HGVs lifted 1.53 billion tonnes of goods in the UK and moved 162 billion tonne kilometres, according to DfT's domestic road freight statistics.
What percentage of UK lorry journeys run empty?
In 2025, 31% of the distance travelled by GB-registered HGVs in the UK was travelled empty, 5,897 million kilometres. In the 12 months to March 2026 the share was 30%.
What is the average length of haul for UK road freight?
105 km in 2025. Articulated HGVs averaged 134 km and rigid HGVs 58 km.
How often are the UK road freight statistics published?
DfT publishes domestic road freight statistics every quarter, with an annual release for each calendar year.
Do the road freight statistics include vans?
No. They are based on a survey of GB-registered heavy goods vehicles, so vans are not included. DfT's road traffic estimates cover vans: van traffic was 58.8 billion vehicle miles in 2025, 10.0% higher than in 2019.
Is lorry traffic in the UK going up or down?
Down. DfT's road traffic estimates put lorry traffic in Great Britain at 16.3 billion vehicle miles in 2025, 1.7% lower than 2024 and 5.1% lower than 2019.
Orca brings route planning, trips and utilisation figures into one system for UK operators. See Orca for transport and logistics, or get in touch to see how your fleet compares.